At BeesApps, our goal is to provide companies with complete and fully customizable management tools to facilitate activity monitoring and increase team efficiency. This month, we are pleased to present a series of new features in the dashboard to facilitate the animation and management of the activity of teams
New Weather Widget
This new widget allows you to have a graphical summary of the activity progress. You will be able to follow
-
the progress of your topics: completed tasks out of the total number of tasks
-
the weather of each subject: percentage of overdue tasks on the number of tasks in progress
Sunny : for a number of overdue tasks lower than 10%.
Cloudy : for a number of overdue tasks between 10% and 40%.
Rainy : for a number of overdue tasks higher than 40%.You can create your weather forecast by objective, project, collaborator, note or subject.

All your Beesy tabs are accessible from a mobile device
All your Eisenhower, Note, Project, People or Action matrix views are now accessible from a smartphone.
Create tasks, take notes, view the progress of your projects directly from your smartphone.

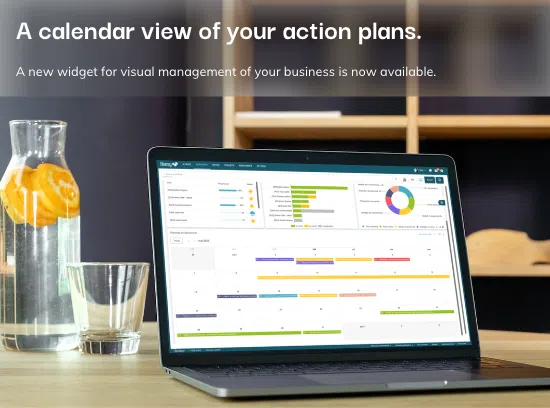
Chronological views for each type of action
This widget has evolved to allow you to have a chronological visibility for all types of actions, by due date or by creation date (news).
For example, you can track your completed deadlines or your risks by completion date, but also integrate into your project reports the tracking of your decisions by creation date.

More Beesy news
1 – A new menu bar for easier access to your dashboards:
- TO DO: to access your to-do list and manage your action plan with the Eisenhower Matrix
- REPORTS: to view your dashboards

2 – You can now view all your widgets by goal: the distribution of your goals with a pie chart, the progress of your goals with a bar chart, the load plan of your goals, the weather forecast of your goals or the list of your actions by goal….
.3 – If you only want to see the activity on a part of your goals. You can also filter your different widgets for one or more goals with the filter and goal option.
4 – You can also sort your activity information by column in your To do list, Weather or Load plan widgets.

– In your dashboards, when you click on a task, you can now access the note or project to which the task is attached.


![[Infographics] The struggle of collaborative overload](http://www.beesapps.com/wp-content/uploads/2022/05/collaborative-overload-400x250.png)