Manage your activity with Beesy project reports
Prioritize your tasks and track your achievements in real time on a single tool
Why use activity reports in your daily life?
Beesy allows you to use different views to monitor your activity:
- Daily management of your tasks with your structured To-do
- A management of your projects with your customizable dashboard
- A general view of the major stages of the project with the timeline view

Management of the actions to be carried out
The dashboard that allows you to easily organize your tasks

Based on Eisenhower Matrice the to-do’s purpose is to allow you to prioritize your tasks and thus to organize yourself more easily.
- Important – non-urgent: This is a task that is important to your project but does not need to be done right away.
- Important – Urgent: These are tasks that you will complete before others
- Not important – not urgent: If some of your tasks are in this section they may not be important and may not be worth doing.
- Not important – urgent: These are tasks that are not important to you but need to be done quickly, this is the time to delegate.
To help you get organized even more easily and quickly, Beesy’s AI allows you to enter tasks on Beesy via email or a Teams conversation. You can indicate the importance and urgency, the project in which you want to integrate it and the person in charge of this task.
The dashboard
The visual reporting that allows you to easily manage your activity
Its objective:
- Easily gather all the important data of its activity
- Build a graphical view of the activity to quickly identify blocking points
- Zoom in on your data to see the details of tasks in progress or overdue

Graph generator
Visual reporting customizable to your needs

Dashboards can be customized to your needs and tastes.
Create graphical views from the data you want to see and get flexibility in the management of your activity.
Export your reports in pdf format or in powerpoint presentation to share them directly with your collaborators.
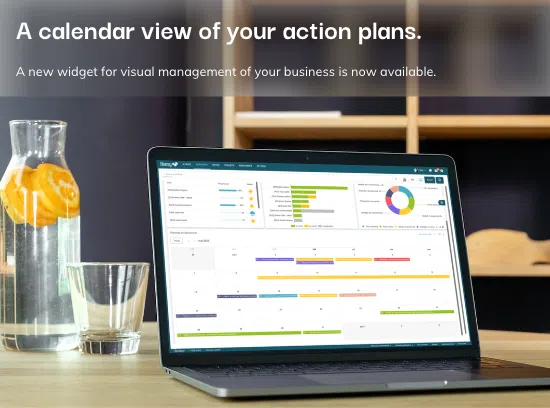
Timeline view
GANTT planning for your projects – Graphical reporting
To simplify the work of planning your tasks, a graphic visualization is an effective tool that allows the brain to have both an overview and a detailed view of what needs to be done.
Planning means dividing your activities in time according to your objectives and the duration of the activities.

Beesy’s Timeline option allows you to easily visualize all the tasks planned for a project and their deadlines. Simple to use, easy to update, and easy to understand, this graphical view of your To-Do list allows you to quickly identify overloaded days or resources and to evaluate the risks on your projects.
It is an efficient way to work on your weekly To-Do list and make decisions quickly.
Real-time reporting
All your data centralized in a single tool
With these specific reporting tools, Beesy accompanies you in your challenge to stay organized in the long term and not to drop your action list after a few weeks of use.
A structured and organized to-do list
An export to automate report management
A fully customizable dashboard
An aggregated view on all data (projects, people,…)